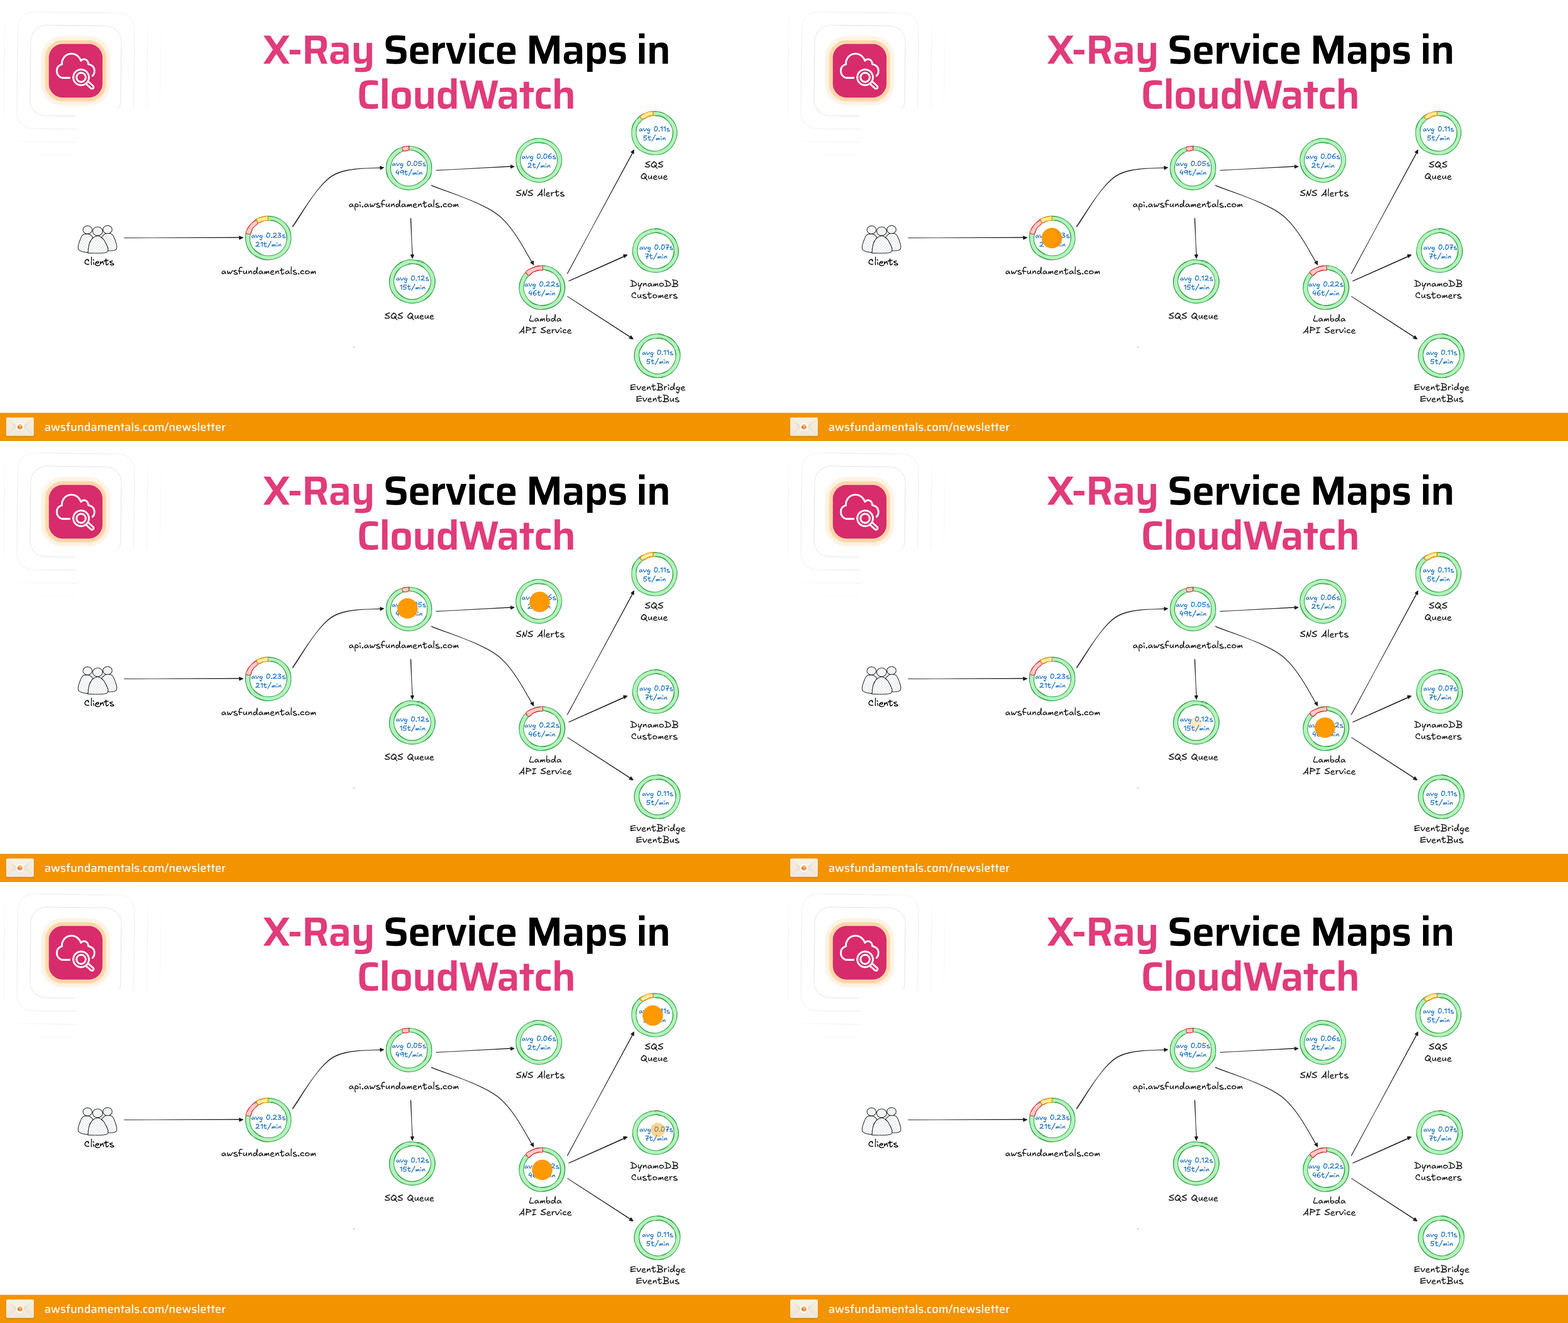
X-Ray Service Maps in CloudWatch
With X-Ray Service Maps in CloudWatch, you can see how your application is performing and service are interacting with each other. You can see the latency of each service, the number of requests and the warning and error rates.

CloudWatch on One Page (No Fluff)
Monitor like a pro. Our CloudWatch cheat sheet covers metrics, alarms, and logs - everything you need for effective AWS monitoring.
HD quality, print-friendly. Stick it next to your desk.
By entering your email, you are opting in for our twice-a-month AWS newsletter. Once in a while, we'll promote our paid products. We'll never send you spam or sell your data.