Build Centralized Alerting across your organization with CloudWatch, EventBridge, Lambda, and CDK


Table of Contents
Jump to a section
The Case for Centralized Alerting
If you use AWS, you use CloudWatch to some extent. Having it as a powerful monitoring tool is nice. As your organization grows, organizing alerts, logs, and metrics becomes harder.
You should have a global way of handling your alerts. It doesn't make sense that all of your developers need to think about where your alerts should arrive. You will end up with a mess of:
- Custom Apps in your IM messengers (Slack, Teams, etc.)
- Webhook Implementations
- Email Alerts
Platform teams should make it as simple as possible for developers to be able to create alerts. These alerts should be handled automatically and arrive at some common point where you can handle them. This is often an instant messaging service like Slack. Or it could also be a ticketing system such as Jira.
In this post, we will show you how to create such an architecture in a multi-account setup in AWS.

CloudWatch on One Page (No Fluff)
Monitor like a pro. Our CloudWatch cheat sheet covers metrics, alarms, and logs - everything you need for effective AWS monitoring.
HD quality, print-friendly. Stick it next to your desk.
Architecture Overview
The architecture consists fully of serverless services.
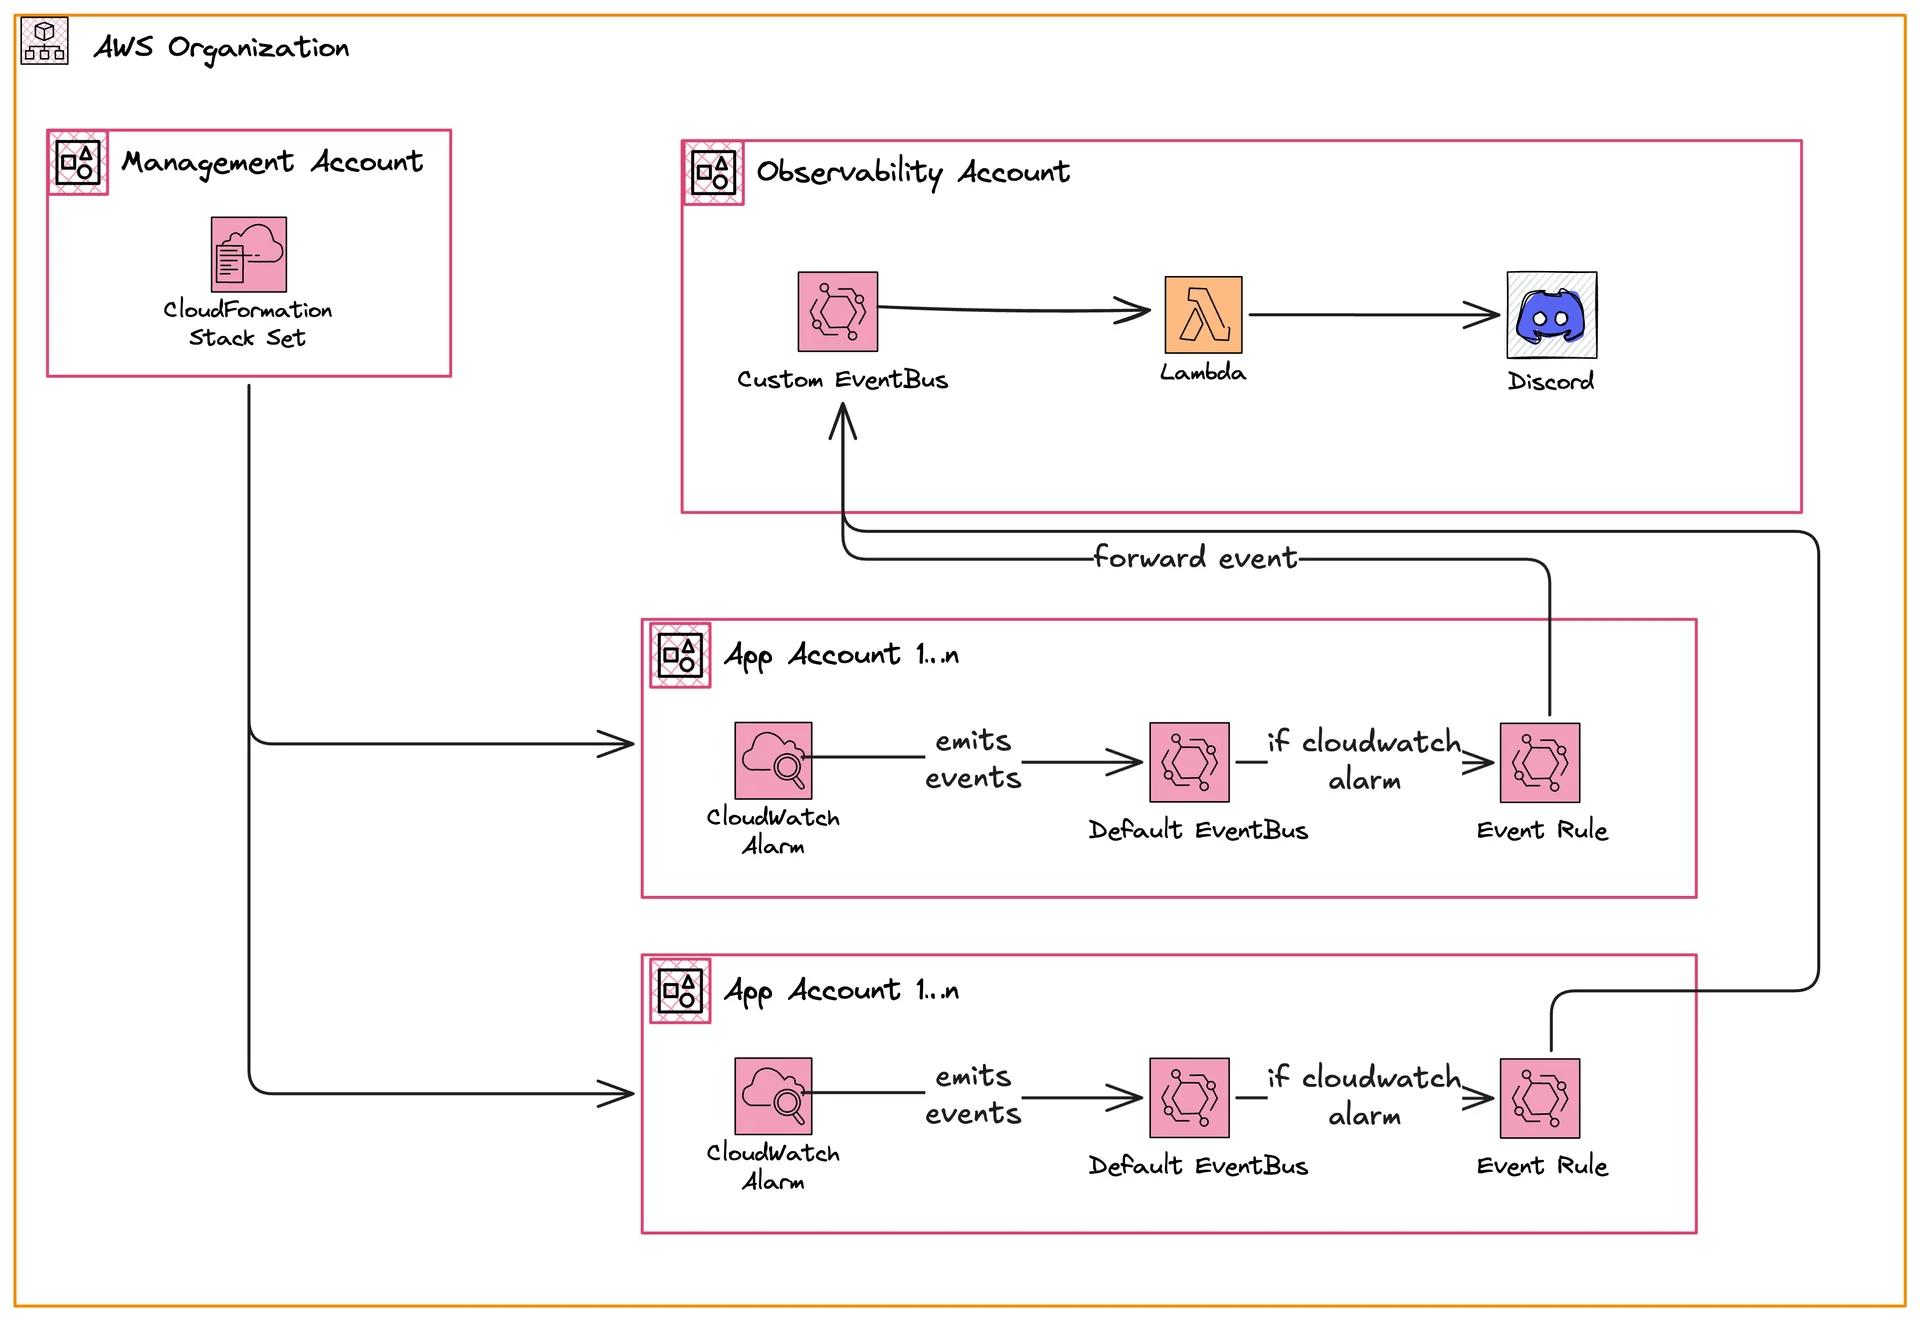
We have three different sets of accounts:
- Management Account
- Member Accounts
- Observability Account
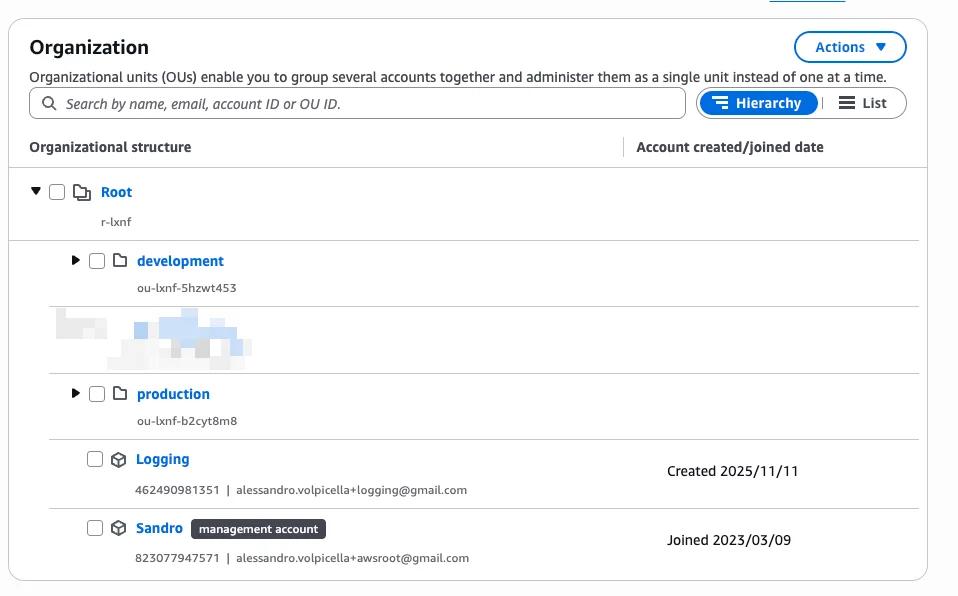
All of these accounts are in an AWS Organization. This organization has different organizational units (OU).
For instance, we could have the following OUs:
- Production
- Development
The observability account could live in its own OU or directly in the root.
Typically, two app accounts exist. One in production and one in development.
Management Account - Deploy Stack Sets to Sub Accounts
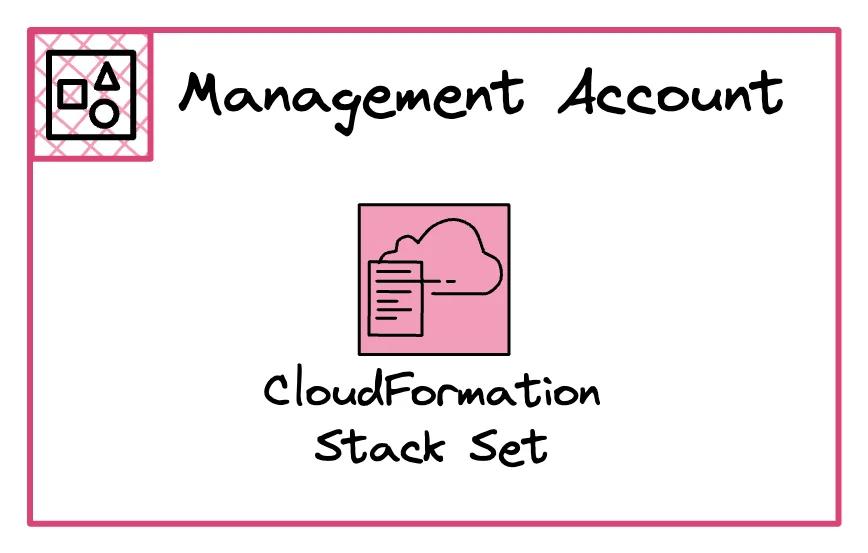
We use CDK, and hence, CloudFormation in this implementation.
This is why we make use of StackSets.
StackSets allow us to define one CloudFormation Stack.
And deploy it into several accounts.
This is very useful if you need to share some resources.
In our implementation, we need to deploy an EventBridge Rule to all accounts.
The EventBridge rule forwards the CloudWatch Alarm events to our observability account.
App Accounts - Build Alerts and Forward Events via EventBridge
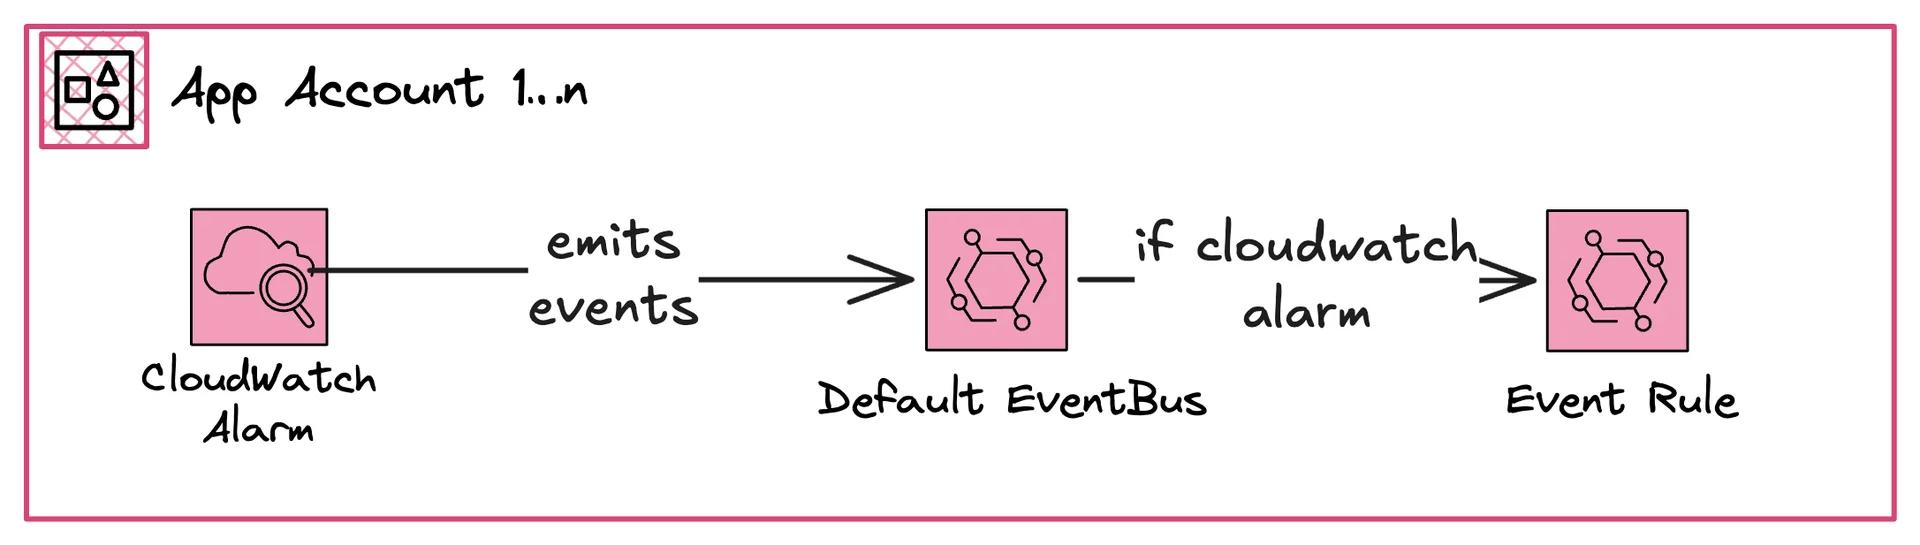
The App Accounts typically hold different projects. For example, it could be your user portal, API, or something else. It is not important for us here to know what exists here.
For us (as platform team in this instance) is just one thing important: The developers of those accounts know best which errors and incidents the application can face. We want to ensure that the developer only needs to create an alarm - nothing else.
We want to keep it as simple as possible for the developers. Developers should focus on building and running the application. They shouldn't need to know anything about how to authenticate with MS Teams via the internal service desk.
The App Account will hold all CloudWatch Alerts.
Observability Account - Handle Alarms
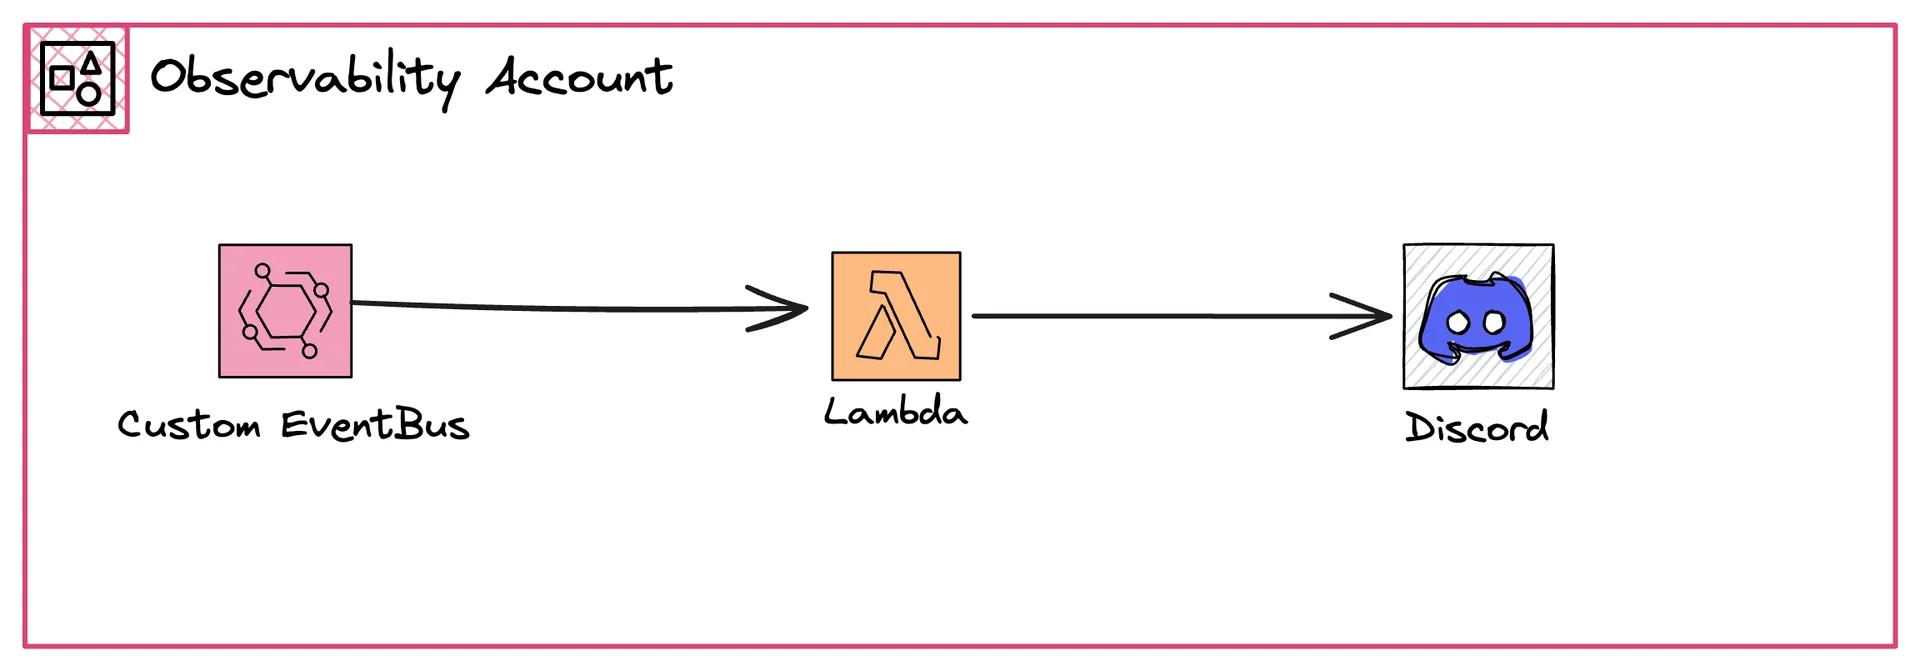
The Observability Account is the main hub of all alerts. Each alert will land in here. Once an alert arrives, we put it into an SQS queue. A Lambda function will poll all of those messages and then send a message to Discord (in our example).
Deploy the Architecture
We came up with a GitHub repository that builds exactly this architecture in our organization.
Install all prerequisites
We use pnpm as a package manager and have node installed.
pnpm i - install all dependencies.
Add placeholders
We've used placeholders in different parts of the config.
You can see it in config/environments.ts.
Mainly:
- Management Account ID
- Observability Account ID
- Organization ID
- OU ID where member accounts live in
- Discord Webhook URL
Once you've added them you can go ahead and deploy!
Here is how the file looks like:
export const config: Config = {
    managementAccount: {
        id: 'XXXXXXXXXXXX',
        region: 'eu-central-1',
    },
    observabilityAccount: {
        id: 'XXXXXXXXXXXX',
        region: 'eu-central-1',
    },
    organizationId: 'o-xxxxxxxxxx',
    targetOUs: ['ou-xxxx-xxxxxxxx'],
    discordWebhookUrl: 'https://discord.com/api/webhooks/xxx/xxx',
};
Deploy Your Observability Account First
Deploy the observability account first. This deploys:
- EventBridge Custom Event Bus
- Lambda Function
- Rule that connects Event Bus and Lambda Function
AWS_PROFILE or however you have your local credentials.Check once if CDK synthesizing works with pnpm cdk synth.
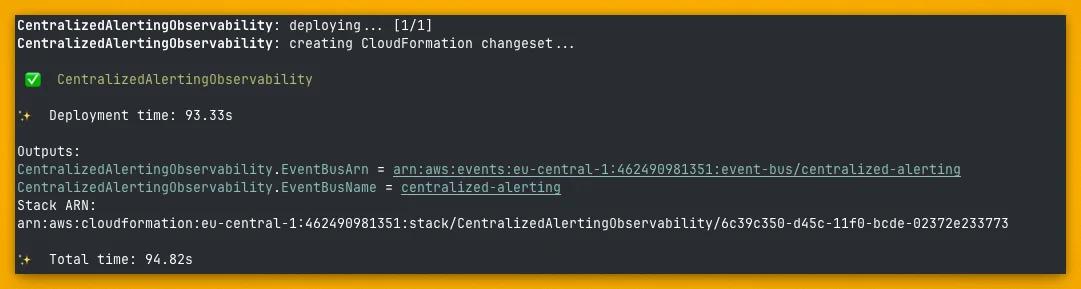
If everything works, go ahead and deploy with pnpm cdk deploy CentralizedAlertingObservability.
Deploy Your Management Account Stack
Next, we deploy the StackSet in the management account.
AWS_PROFILE or however you have your local credentials.Depending on the size of your organization this can take ages. This will deploy it in every sub-account!
Test It Out
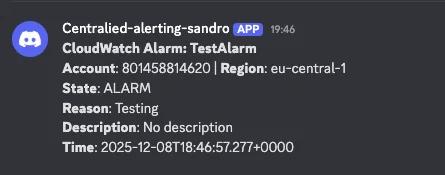
You can test it out by creating an alarm and setting it to active. We've created an alert in an account in our production OU and set it on active with this command:
aws cloudwatch set-alarm-state --alarm-name <ALARM_NAME> --state-reason "Testing" --state-value ALARM --region eu-central-1
Check Your Result
Check your Lambda logs and Discord channel to confirm the alert arrived.
Further Steps
Make the severity dynamic
Not all alerts are equal. There are alerts that sometimes occur and should be checked. But there are also alerts that indicate a major incident.
In this implementation, we handle all alerts in the same way. But real-world systems often need more granularity. Developers should be able to specify alert severity levels.
For that, we would recommend adding a tag like severity to the alert.
Once you've added that you can define what should happen for very severe alerts.
Dynamic Config
If you have a large organization and multiple app developers you need to be even more dynamic. Severity alone won't scale to larger organizations.
You often have different responsible people, pager duty alerts, etc. For that, we recommend having an own SSM Parameter for each alert.
You could tag your alert with the responsible team, project, config name.
Then for each alarm you can have your own SSM config like alerts/team-1.
Once your alarm is handled you can read in this config.
The config could look like this:
{
    "topicArn": "sns:xxxx",
    "onRotation": "Tobias Schmidt",
    "teamsChannel": "xxxx"
}
This makes your execution much more dynamic.
Resources
https://aws.amazon.com/blogs/mt/how-to-centralize-cloudwatch-alarms-with-amazon-eventbridge-and-aws-cloudformation/
Related Posts
Similar content found using AWS S3 Vectors semantic search


